In the previous posts I have mentioned using Scikit-Learn, gRPC, Mesos and Prometheus. In the following, I would like to tell how all these components can be used to build a classification service and my experience with running it in a relatively large production system. For practical reasons I omit most of the actual code, and instead describe the important parts of the server script and give a reference to the external documentation when necessary.
THE PROBLEM
As a part of our daily operation at Cxense we crawl millions of Web-pages and extract their content including named entities, keywords, annotations, etc. As a part of this process we automatically detect language, page type, sentiment, main topics, etc. Skipping the details, in the following we implement yet another text classifier using Scikit-Learn.
As most of our system is implemented in Java, also including the crawler, we implement this classifier as a micro-service. For some documents therefore, the crawler will call our service, providing page title, url, text, language code and some additional information and in return retrieve a list of class names and their approximate probabilities. We further use an absolute time limit of 100 ms (end-to-end) for the classification task.
THE SOLUTION
For classification itself we use a simple two-stage pipeline, consisting of a TfidfVectorizer and a OneVsRestClassifier using LinearSVC. A separate model is trained for each of the several supported languages, serialized and distributed on the deployment. In order to communicate with our service, we use gRPC, where we define the protocol in the proto3 format and compiled it for both Java (the client) and Python (the server):
syntax = "proto3";

service Classifier {
    rpc Classify(Document) returns (Classification) {}
}

message Document {
    string url = 1;
    string title = 2;
    string text = 3;
    Language lang = 4;
    ...
}

message Classification {
    repeated Class classes = 1;
    message Class {
        string name = 1;
        float prob = 2;
    }
}
Next we implement a simple servicer, which invokes the classifier for a given language with the remaining request fields and return the classification results (class names and scores) wrapped in a response object:
...
class ClassifierServicer(proto_grpc.ClassifierServicer):

    def __init__(self):
        self.models = ...

    def Classify(self, request, context):
        url = request.url
        title = request.title
        text = request.text
        lang = proto.Document.Language.Name(request.lang)
        results = self.models[lang].classify(url, title, text)
        return proto.Classification(
            [proto.Classification.Class(name, prob) for name, prob in results])
To measure classification latency and the number of exceptions we further add a number of Prometheus metrics and annotate the classification method:
...
class ClassifierServicer(proto_grpc.ClassifierServicer):
    ...
    REQUEST_LATENCY = Histogram('clf_latency_seconds', 'Request latency in seconds')
    REQUEST_ERROR_COUNTER = Counter('clf_failures', 'Number of failed requests')

    ...
    @REQUEST_LATENCY.time()
    @REQUEST_ERROR_COUNTER.count_exceptions()
    def Classify(self, request, context):
        ...
To log the classification requests and results we add a queue to the servicer and write serialized JSON objects to it on request. We also implement a scheduled thread that drains the queue and writes the strings to disk:
...
     def __init__(self):
        ...
    	self.log_queue = queue.Queue()

   	def Classify(self, request, context):
    	...
    	self.log_queue.put(json.dumps({'url': url, 'title': title, 'text': text, 'language': lang, 'classification': dict(results)}))

    def log_requests(self):
        # Drain the queue:
        requests = []
        while not self.log_queue.empty():
            requests.append(self.log_queue.get())

        # Write to file:
        if requests:
            filename = datetime.now().strftime('./request-%Y-%m-%dT%H.log')
            with open(filename, 'a', encoding='utf_8') as f:
                for request in requests:
                    f.write(request + '\n')

        # Repeat every second:
        t = threading.Timer(1, self.log_requests)
        t.daemon = True
        t.start()
The reason for doing this is that we want to avoid waiting for disk I/O on the classification requests. In fact this trick dramatically improves the observed latency on the machines with heavy I/O load and bursty requests.
Further we customize the HTTP server used by Prometheus client to return metrics on /metrics path (used for metric collection), “status”:”OK” on /status (used for health checks) and 404 otherwise:
...
def start_http_server(port):
    class HttpRequestHandler(BaseHTTPRequestHandler):
        def do_GET(self):
            if self.path == '/status':
                self.send_response(200)
                self.send_header('Content-type', 'text/plain; charset=utf-8')
                self.end_headers()
                self.wfile.write(bytes('{"status": "ok"}', 'utf-8'))
            elif self.path == '/metrics':
                self.send_response(200)
                self.send_header('Content-type', CONTENT_TYPE_LATEST)
                self.end_headers()
                self.wfile.write(generate_latest(core.REGISTRY))
            else:
                self.send_error(404)

        def log_message(self, format, *args):
            return

    class HttpRequestServer(threading.Thread):
        def run(self):
            httpd = HTTPServer(('', port), HttpRequestHandler)
            httpd.serve_forever()

    t = HttpRequestServer()
    t.daemon = True
    t.start()
Now, we implement the server itself as a thread taking two ports as arguments. The http port is used for health checks and metric collection and the grpc port is used for classification requests. For the http port we will use the number supplied by Aurora (see below) and for the gprc port we use port 0 to get whatever is available. To know which ports were allocated we write both to a JSON file:
...
class ModelServer(threading.Thread):

    def __init__(self, http_port, grpc_port=0):
        super(ModelServer, self).__init__()
        self._http_port = http_port
        self._grpc_port = grpc_port
        self._classifier = ClassifierServicer()
        self._stopper = threading.Event()

    def stop(self):
        self._stopper.set()

    def stopped(self):
        return self._stopper.isSet()

    def run(self):
        self._classifier.log_requests()

        grpc_server = grpc.server(futures.ThreadPoolExecutor(max_workers=8))
        proto_grpc.add_ClassifierServicer_to_server(self._classifier, grpc_server)
        self._grpc_port = grpc_server.add_insecure_port('[::]:%s' % self._grpc_port)
        grpc_server.start()

        start_http_server(self._http_port)

        service_info = json.dumps({'services': [
                {'service': 'clf-grpc', 'port': self._grpc_port},
                {'service': 'clf-health', 'port': self._http_port}]})
        print_and_flush(service_info)

        with open('./service.json', 'w', encoding='utf-8') as f:
            f.write(service_info)

        try:
            while not self.stopped():
                time.sleep(1)
        except KeyboardInterrupt:
            print_and_flush("halting...")
        finally:
            grpc_server.stop(0)

def print_and_flush(s):
    print(s)
    sys.stdout.flush()

if __name__ == '__main__':
    print_and_flush('loading...')
    ModelServer(http_port=int(sys.argv[1])).start()
Threading logic herein allows us quite simple unit test usage, for example:
...
class TestAll(unittest.TestCase):

    @classmethod
    def setUpClass(cls):
        ...
        # Build and serialize test models.
        for language in [...]:
            train_model(language)

        # Start the server, give it some time.
        cls.server = ModelServer(http_port=12345)
        cls.server.start()
        time.sleep(1)

    def test_basics(self):
        address = 'localhost:%s' % TestAll.server._grpc_port
        result = classify(address, ...)
        self.assert...

    @classmethod
    def tearDownClass(cls):
        # Stop the server, give it some time.
        cls.server.stop()
        time.sleep(1)

        # Delete temporary files.
        os.remove('service.json')
        for logfile in glob('request-*.log'):
            os.remove(logfile)

if __name__ == '__main__':
	unittest.main()
Further, we provide Aurora configuration that consists of the following tasks:
- Fetch code and data from into the sandbox.
- Activate virtual environment and start the server using
thermos.ports[http] - Wait for service.json to be written and register clf-health and clf-grpc in the consulate. Use clf-health for httpcheck.
- On shutdown, deregister the service in consulate.
- Otherwise, delete request logs that are more than 12 hours old.
fetch_all = ...

run_server = Process(
  name = 'run_server',
  cmdline = 'source venv/bin/activate && venv/bin/python server.py ')

register_service = Process(
    name = 'register_service',
    cmdline = 'HTTP=$(service-file-get clf-health service.json 300); \
        GRPC=$(service-file-get clf-grpc service.json 0); \
        consulate register clf-health -s clf-health -a $(hostname) -p $HTTP httpcheck 10 http://localhost:$HTTP/status; \
        consulate register clf-grpc -s clf-grpc -a $(hostname) -p $GRPC httpcheck 10 http://localhost:$HTTP/status')

deregister_service = Process(
    name = 'deregister_service',
    final = True,
    cmdline = '/usr/local/bin/consulate deregister clf-health; \
        /usr/local/bin/consulate deregister clf-grpc; sleep 5')

log_removal = Process(name = 'log_removal', cmdline = 'while true; do find . -name request\*.log -mmin +720 -print0 | xargs -0 --no-run-if-empty rm; sleep 3600; done')

server_task = SequentialTask(processes = [fetch_all, run_server], resources = Resources(cpu=1, ram=4*GB, disk=3*GB))
register_task = Task(processes=[register_service], resources=Resources(cpu=0.01, ram=0.1*MB, disk=1*MB))
deregister_task = Task(processes=[deregister_service], resources=Resources(cpu=0.01, ram=0.1*MB, disk=1*MB))
log_removal = Task(processes=[log_removal], resources=Resources(cpu=0.01, ram=0.1*MB, disk=1*MB))

jobs = []
for dc in [...]:
  jobs.append(Service(cluster = dc,
          environment = 'prod',
          tier = 'preferred',
          role = ...,
          name = 'clf',
          update_config = UpdateConfig(watch_secs = 300, batch_size = 1),
          task = Tasks.combine(server_task, register_task, deregister_task, log_removal),
          constraints = {'host': 'limit:1'},
          instances = 4))
Note that here we use four instances per data center, each requires slightly more than 1 CPU, 4GB RAM, 3GB disk. We also restrict our job to have no more than one instance per host
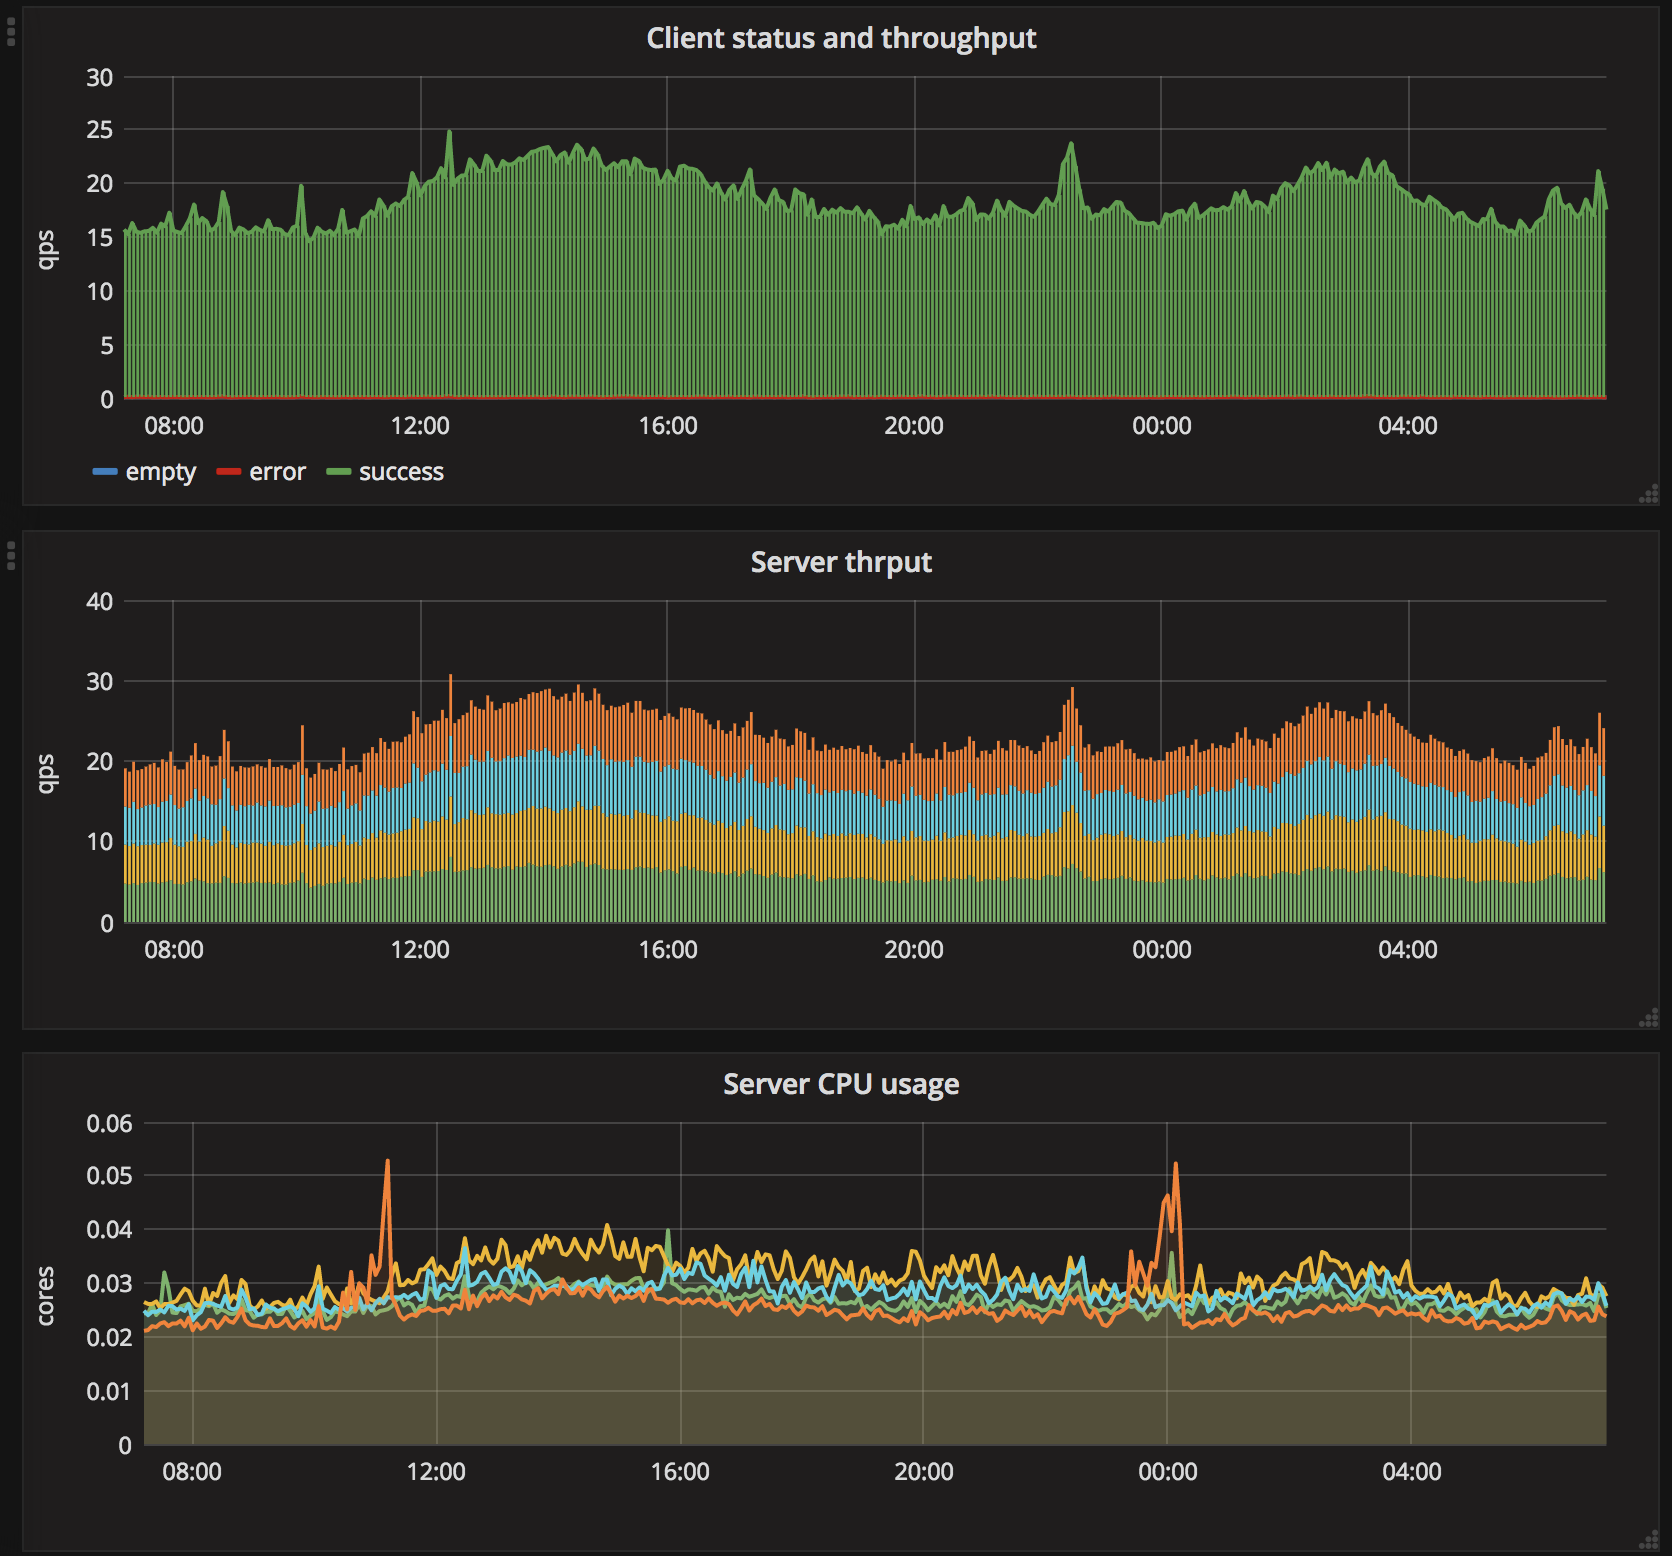
From here we can start, stop, update and scale our jobs using Aurora’s client commands. Beyond what is mentioned we implement classification service client in Java and embed it into the crawler. Cxense codebase includes code for automatic resolve of clf-grpc to a list of healthy servers, and even scheduling up to 3 retries with 20 ms between and final time-out at 100ms. Here we also use Prometheus to monitor client latency, number of failed requests, etc. Moreover, we configure metric export from both clients and service, set up a number of service alerts (on inactivity, too long latency or high error rate) and Grafana dashboards (one for each DC).
THE EXPERIENCE
Initially I was quite skeptical about using Python/Scikit-Learn in production. My suspicions “were confirmed” by a few obstacles:
- The gRPC threads above are bound to one CPU and it is really hard to do anything about that in Python. However, this is not a big deal as we can scale by instances instead of cores. In fact, it is better.
- Ocasionally tasks get assigned to “slow” nodes which makes 90+ percentile latency higher in orders of magnitude. After some investigation with colleagues, we found that this may happen on I/O overloaded nodes. Delayed logging demonstrated above gave us a dramatic improvement here, so it wasn’t that much of issue anymore. Otherwise, we could add a supervisor to restart unlucky jobs.
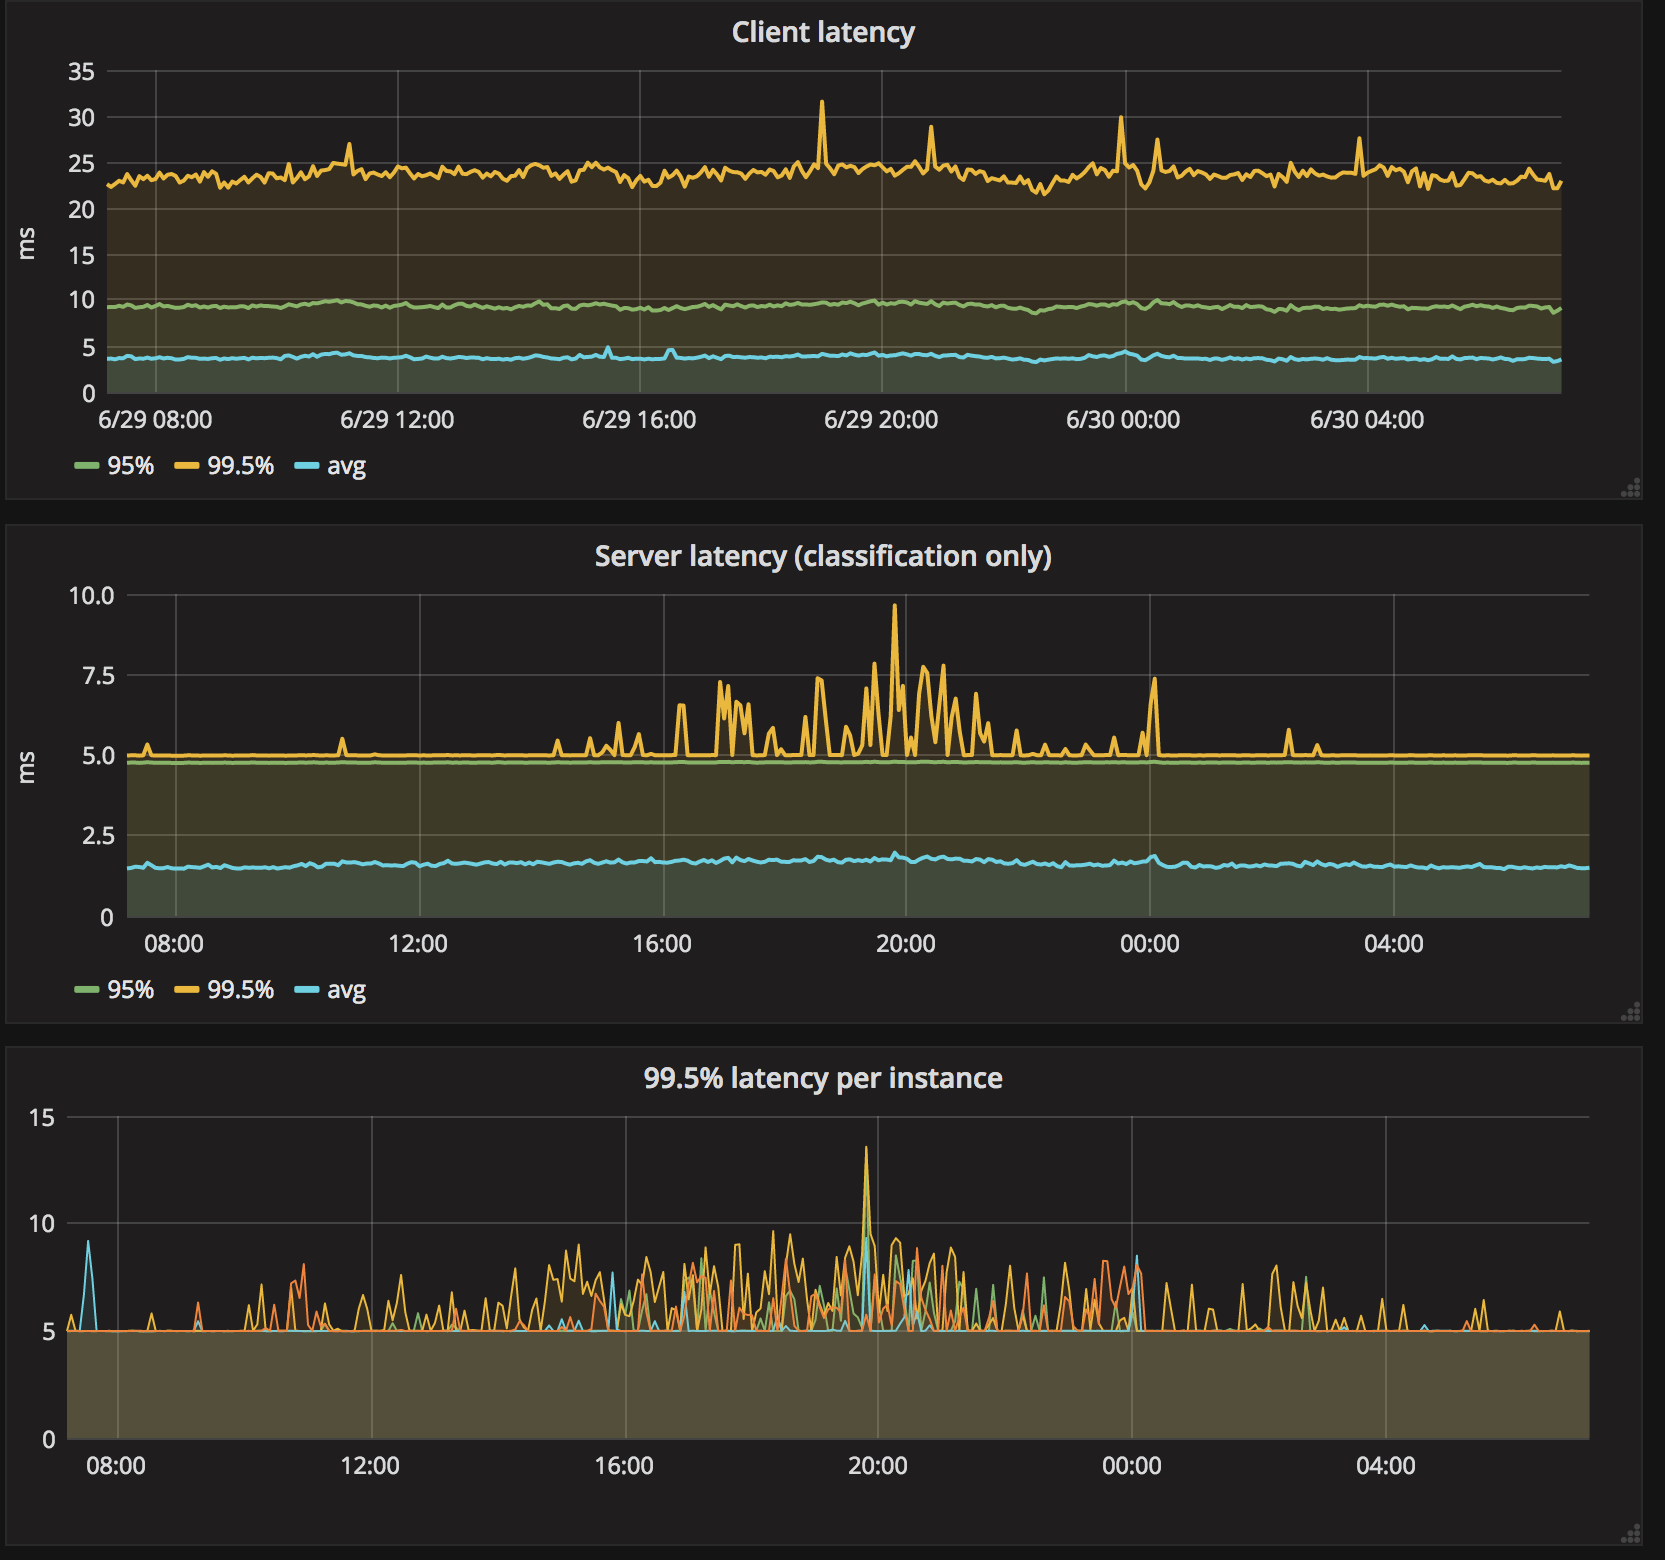
- Grpc address lookup makes client-observed latency significantly worse than the clasification port itself. However, our codebase implements a short-term address cache, and for cached addresses the latency increase is not a big deal. The problem we have seen initially was that with a large number of crawlers and relatively small fraction of classification requests, the cold-cache chance is quite high. With increasing number of requests however, the chance of this goes down and the latency goes down as well.
- We have observed that for bursty traffic latency jitter can be quite high and the first few requsts after a pause are likely to be out-of-time. For the client, I assume it is because of the cost of loading models back into memory and CPU caches. For the server, I assume it is becauce of the closed connections and cold address caches. The funny part here was that this issue is less with increased number of requests. In fact, we have seen latency (both for the client and the server) go down after doubling the number of requests by adding support for a new language without increasing the total resource budget (CPU, RAM, disk).
So in total, the experience in prod was quite postive. Apart from the points mentioned above, there were no problems or accidents and I have not seen any server-side exceptions. The only time I had to find why the classifier was suddenly inactive was when AWS S3 went AWOL and broke the Internet.
On the final note, here is a dashboard illustrating the performance on production traffic in one of our datacenters (the legend was removed from some of the charts).