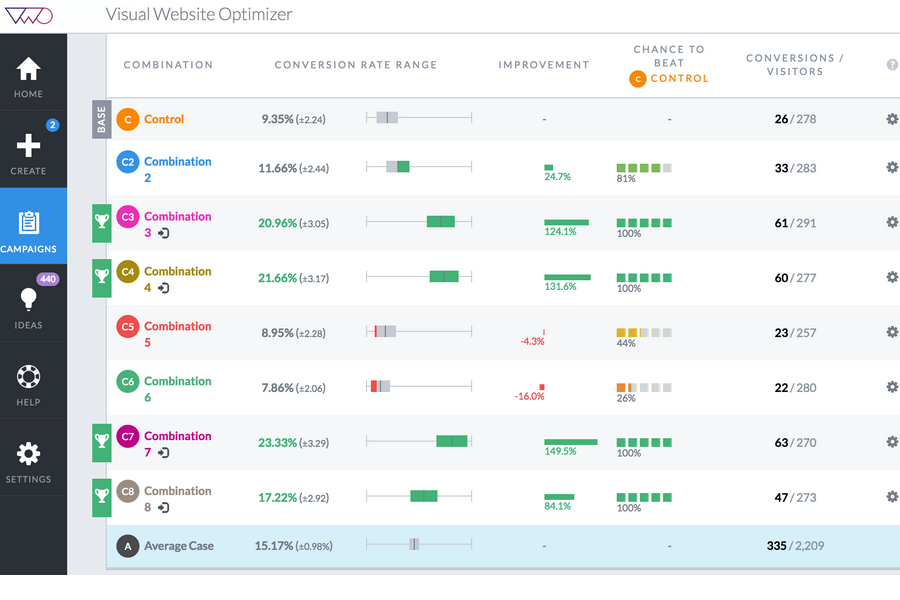
Have you wondered how to design and run online experiments? In particular, how to implement an experiment dashboard such as the one enpictured below (in this case Visual Website Optimizer) and how to use this in your product? Good, lets have a quick look!
On a pure technicall side, the first thing we have to implement is a way to define an experiment as a set of variables we want to try out and a value mapping for the audience. The most important part here is that, for a signle user, the assignment should be the same for a single experiment, e.g., the user is always in the same of two groups. However, it should different across the experiments. The latter is known as a carry-over error, and it is for example if the same user is assigned to the same test group across different experiments.
Facebook has previously released PlanOut, a platform for Online field experiments. Apart from the language itself, the essense of this project is in the random.py which demonstrates a possible way of mapping users or pages to the random aleternatives. In short, each experiment and variable has a salt to be added on top of the user or page id hash to enforce randomization across experiments and variables. The resulting hash is then mapped to the final value through modulo arithmetic and a set of linear transformations. Given this, it is fairly easy to design an API or a library to represent an experiment with a variety of options and to assign those to users in a controlled and consistent fashion. Or you can just use PlanOut or VWO right out of the box.
Settled with the setup and random assignment parts, the next question is how to actually design and run an experiment for your needs. For this, I highly recomment to take a quick look at the original paper describing PlanOut and its presentation, as well as a nice presentation and a great tutorial about implementing and analysing online experiments at Facebook. Furthermore, there is a series of interesting publications from Microsoft (a survey, a paper and another paper) explaining numerous caveats of running controlled experiments on the web. In particular it explains statistical significance, power, and several types of mistakes it is possible to run into.
If resarch papers sound just too dry and formal, there are several interesting guides explaining A/B testing and its pitfalls in a very accessible manner:
- A/B tests. How to make it reasonable (Edrone)
- The ultimate guid to A/B testing (Unbounce)
- Why Every Internet Marketer Should Be a Statistician (Analytics Toolkit)
- Type 1 and 2 errors, and how large should your A/B test sample size be (Visual Website Optimizer)
Finally, when it comes to presenting and interpreting the results, this A/B test analysis tool provides a simple view similar to the one in the screenshot above. Otherwise, there are several online calculators for various computations that do not require a PhD in statistics - sample size, experiment duration,comparing two rates (chi-squared test), comparing two series (t-test).
Have fun!